Hierarchy
The elements of a dimension can be organized as a hierarchy, a set of parent-child relationships,
typically where a parent member summarizes its children. Parent elements can further be aggregated
as the children of another parent.
A Hierarchy is a set of logically related attributes with a fixed cardinality. While browsing the data, a hierarchy exposes the top level attribute which can be broken down into lower level attributes. For example, Year -> Semester – Quarter – Month is a hierarchy. While analyzing the data, it might be required to drill down from a higher level to a detail level, and exposing data as a hierarchy.
example - dimemployee table have data in parent-child relation "employeeID" and "ParentEmployeeId".
SSAS example - link soon provided
Operations to facilitate analysis.
Aligning the data content with a familiar visualization enhances analyst learning and productivity.
The user-initiated process of navigating by calling for page displays interactively, through the specification of slices via rotations and drill down/up is sometimes called "slice and dice".
Common operations include slice and dice, drill down, roll up, and pivot.
OLAP slicing
Slice is the act of picking a rectangular subset of a cube by choosing a single value for one of its dimensions, creating a new cube with one fewer dimension.
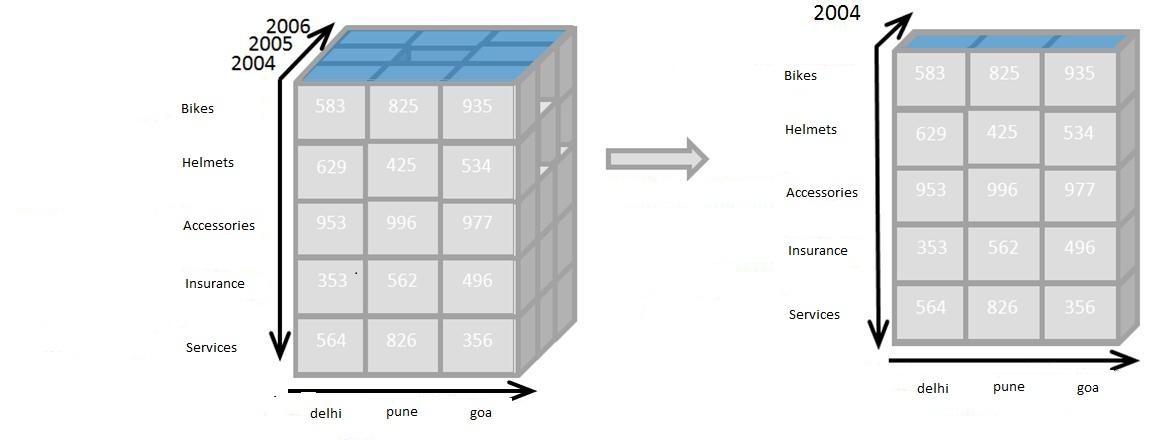
The picture shows a slicing operation: The sales figures of all sales regions and all product categories of the company in the year 2004 are "sliced" out of the data cube.
Query compare : equivalent to clause "where year = 2004"
OLAP dicing
Dice: The dice operation produces a subcube by allowing the analyst to pick specific values of multiple dimensions.

The picture shows a dicing operation: The new cube shows the sales figures of a limited number of product categories, the time and region dimensions cover the same range as before.
Query compare - equivalent to "where year in (2004,2005,2006) and category in ('bikes','helmets','acc.')"
OLAP Drill-up and drill-down
Drill Down/Up allows the user to navigate among levels of data ranging from the most summarized (up) to the most detailed (down).
Drill down presenting the data at lower level on hierarchy.
Drillup presenting the data at higher level on hierarchy.

The picture shows a drill-down operation: The analyst moves from the summary category "bike" to see the sales figures for the individual products.
Drill down and up can be possible if we have meaningful hierarchical data in schema.
Roll-up: A roll-up involves summarizing the data along a dimension. The summarization rule might be computing totals along a hierarchy or applying a set of formulas such as "profit = sales - expenses".
OLAP pivoting
Pivot allows an analyst to rotate the cube in space to see its various faces. For example, cities could be arranged vertically and products horizontally while viewing data for a particular quarter. Pivoting could replace products with time periods to see data across time for a single product.

The picture shows a pivoting operation: The whole cube is rotated, giving another perspective on the data.
Source: http://en.wikipedia.org/wiki/OLAP_cube
Some topic related posts
OLAP CUBE
Storage types of cube MOLAP, ROLAP, HOLAP
Advantage and disavantage of MOLAP, ROLAP
Create your first OLAP Cube in SSAS
The elements of a dimension can be organized as a hierarchy, a set of parent-child relationships,
typically where a parent member summarizes its children. Parent elements can further be aggregated
as the children of another parent.
A Hierarchy is a set of logically related attributes with a fixed cardinality. While browsing the data, a hierarchy exposes the top level attribute which can be broken down into lower level attributes. For example, Year -> Semester – Quarter – Month is a hierarchy. While analyzing the data, it might be required to drill down from a higher level to a detail level, and exposing data as a hierarchy.
example - dimemployee table have data in parent-child relation "employeeID" and "ParentEmployeeId".
SSAS example - link soon provided
Operations to facilitate analysis.
Aligning the data content with a familiar visualization enhances analyst learning and productivity.
The user-initiated process of navigating by calling for page displays interactively, through the specification of slices via rotations and drill down/up is sometimes called "slice and dice".
Common operations include slice and dice, drill down, roll up, and pivot.
OLAP slicing
Slice is the act of picking a rectangular subset of a cube by choosing a single value for one of its dimensions, creating a new cube with one fewer dimension.
The picture shows a slicing operation: The sales figures of all sales regions and all product categories of the company in the year 2004 are "sliced" out of the data cube.
Query compare : equivalent to clause "where year = 2004"
OLAP dicing
Dice: The dice operation produces a subcube by allowing the analyst to pick specific values of multiple dimensions.
The picture shows a dicing operation: The new cube shows the sales figures of a limited number of product categories, the time and region dimensions cover the same range as before.
Query compare - equivalent to "where year in (2004,2005,2006) and category in ('bikes','helmets','acc.')"
OLAP Drill-up and drill-down
Drill Down/Up allows the user to navigate among levels of data ranging from the most summarized (up) to the most detailed (down).
Drill down presenting the data at lower level on hierarchy.
Drillup presenting the data at higher level on hierarchy.
The picture shows a drill-down operation: The analyst moves from the summary category "bike" to see the sales figures for the individual products.
Drill down and up can be possible if we have meaningful hierarchical data in schema.
Roll-up: A roll-up involves summarizing the data along a dimension. The summarization rule might be computing totals along a hierarchy or applying a set of formulas such as "profit = sales - expenses".
OLAP pivoting
Pivot allows an analyst to rotate the cube in space to see its various faces. For example, cities could be arranged vertically and products horizontally while viewing data for a particular quarter. Pivoting could replace products with time periods to see data across time for a single product.
The picture shows a pivoting operation: The whole cube is rotated, giving another perspective on the data.
Source: http://en.wikipedia.org/wiki/OLAP_cube
Some topic related posts
OLAP CUBE
Storage types of cube MOLAP, ROLAP, HOLAP
Advantage and disavantage of MOLAP, ROLAP
Create your first OLAP Cube in SSAS
No comments:
Post a Comment