Showing posts with label SSAS. Show all posts

Tuesday, May 27, 2014

Explore cube using microsoft excel

The cube we have created in SSAS in previous post, can be explore, drill down, pivot using microsoft excel.
Parallel excel shows the aggregated data and it also show the related graph for the same cube.

Below are the steps to connect to excel with ssas engine.

1. Open DATA> From Other Sources > From Analysis server
and you can see the below image.
- and the server name of sqlserver so that it can connect to the database


2. Next , now you can see the next page in the wizard. We have to select the database from drop down menu.

 3. Finsh the Wizard after selecting the database from drop down menu.

4. Below popup window now you can see, I select "PivotChart and PivotTableReport" means it will show us the data as well as the graphical chart for the report.


5. If you see the below image carefully, on very right hand side top, similar window you can see in excel and you can check the columns to add it into chart. Where i check the "sales Amount" , "Tax Amt" , "Profit" columns.

From column A i.e. Row Labels is a hierarchy column based on "product color".
Column E and F reflecting the KPI Goal and KPI status again i have check the value (using check box) from right hand side top window.


We can the dimension by check or uncheck the column and can observe the charts and we can track the organization goals.


Friday, May 23, 2014

Some Simple MDX queries

Multidimensional Expressions (MDX) lets you query multidimensional objects, such as cubes, and return multidimensional cellsets that contain the cube's data.


1. Simple MDX Query
select [Measures].[Sales Amount] on columns
,[Dim Product].[Colorkey].[Colorkey] on rows
from [Adventure Works DW]


2. Slicing /WHERE CLAUSE - To Slice Data from cube we can use Where clause , SALES OF HELMET
    select [Measures].[Sales Amount] on columns,
         [Dim Product].[Colorkey].[Colorkey] on rows
    from [Adventure Works DW]
        where [Dim Product].[Product Subcategory Key].&[31]


    OR We can USE "member" FUNCTION - In above query we use "[Dim Product].[Colorkey].[Colorkey]" in rows, where the third attribute in string represent the member of the color key. We can also omit the third attribute from string and we can use "member" instead of it.
    select [Measures].[Sales Amount] on columns,
        [Dim Product].[Colorkey].members on rows
    from [Adventure Works DW]
    where [Dim Product].[Product Subcategory Key].&[31]


3. Example from Snow flake schema:
    select [Measures].[Sales Amount] on columns,
        non empty  [Dim Product].[Hierarchy].[Product Category Key] on rows
    from [Adventure Works DW]


4. Apply Filtering on data using Filter function
    select [Measures].[Sales Amount] on columns
        --,[Dim Product].[Colorkey].[Colorkey] on rows
        ,filter([Dim Product].[Colorkey].[Colorkey].members,
        [Measures].[Sales Amount] >4000000) on rows
    from [Adventure Works DW]

5. Drill down  the cube dimension

    SELECT       {[Measures].[Sales Amount]} ON COLUMNS,
          {[Dim Product].[Product Category Key] } on rows
    FROM       [Adventure Works DW]

          --

    SELECT       {[Measures].[Sales Amount]} ON COLUMNS,
          DRILLDOWNLEVEL({[Dim Product].[Product Category Key] }) ON ROWS
    FROM      [Adventure Works DW]
         
          --
         
    SELECT       {[Measures].[Sales Amount]} ON COLUMNS,
          DRILLDOWNLEVEL({ [Dim Product].[Product Subcategory Key]}) ON ROWS
    FROM       [Adventure Works DW]

Tuesday, May 20, 2014

Create KPI using ssas (Sqlserver analysis services)

KPI is a quantifiable measurement for gauging business success. One of the most useful features of an Analysis Service cube is the ability to define key performance indicators (KPIs) within the cube that allow for a graphical representation of the current state of your business

1. create cube as below post
http://j4info.blogspot.in/2014/05/6-hierarchy-using-dimproduct-category.html

upto this our cube using existing datawarehouse columns, here we not have any goal set column which can gave us the value on which we can set KPI.
Now we create a "CALCULATED MEMBER"


When you create a KPI, you NEED one or more members in a measure group or dimension. However, in some cases, the existing members don’t support the type of KPI you want to create, at least not in their current form. If that’s the case, you can create a calculated member, which is similar to creating a computed column in a SQL Server database.

2. To create a calculated member, open your Analysis Services project in SQL Server Business Intelligence Development Studio (BIDS), and then open the cube in which you want to create your KPI.
In Cube Designer, click the "Calculations" tab, and then click the "New Calculated Member" button. A new calculation form opens in the right pane.


- You should first name the calculated member by typing the name in the Name text box. For this example, I use the following name:
 [Profit]
- Select measure group from "Parent hierarchy" drop down column.
- In "Expression" box set expression which will give us the profit percentage. Later this calculated member used for goal calculation.
  copy and paste below code in "Expression" box.
 ( [Measures].[Sales Amount] - [Measures].[Total Product Cost]) /
 [Measures].[Sales Amount]

- Process it.
- If you want to see the script for same, "script view" button.
That’s all there is to creating a calculated member. Be sure to save the project and then process the cube so the measure is available to your KPI. After you process your cube, you can verify that the measure has been successfully added by browsing the cube data and viewing the "Profit" measure.

3. Now we create KPI
- In cubeMove to the tab "KPI"
- Click on button "New KPI"
- Now if you see the window on right hand side
- Name: GIve any name for KPI
- Value Expression: An MDX expression that returns the KPIs actual value. A value expression is a physical measure such as Sales, a calculated measure such as Profit, or a     calculation that is defined within the KPI by using a Multidimensional Expressions (MDX) expression. Add below in "Value Exression" box:

  [Measures].[profit]
 
  Also, as with the calculated member, you can drag the name from the hierarchies listed in the lower-left pane to the expression text box.

- The goal expression: A goal expression is a value, or an MDX expression that resolves to a value, that defines the target for the measure that the value expression defines.   For example, a goal expression could be the amount by which the business managers of a company want to increase sales or profit.
       
    case
    when [Dim Product].[Product Category Key]
        is [Dim Product].[Product Category Key].&[1]
            then .40
    when [Dim Product].[Product Category Key]
        is [Dim Product].[Product Category Key].&[3]
            then .20
    when [Dim Product].[Product Category Key]
        is [Dim Product].[Product Category Key].&[4]
    then .10
else .15
end

   
  where [Dim Product].[Product Category Key] = [Dim Product].[Product Category Key].&[1] is for bike, i just pick and drop product category MEMBER from left pane to GoalExpression pane box.

   
- The status expression: A status expression is uses to evaluate the current status of the value expression compared to the goal expression. A goal expression is a normalized  value in the range of -1 to +1, where -1 is very bad, and +1 is very good.
  The status expression displays a graphic to help you easily determine the status of the value expression compared to the goal expression.

  i use trafic light signal from here, You can select any other status signal type from drop down menu. Use below code in Status Expression box.
 
  case when  kpivalue("KPI") / kpigoal("KPI") >.60 then 1
when  kpivalue("KPI") / kpigoal("KPI") = .60 then 0
when kpivalue("KPI") / kpigoal("KPI") < .60 then -1
end


- The trend expression: A trend expression is uses to evaluate the current trend of the value expression compared to the goal expression. The trend expression helps the business user to quickly determine whether the value expression is becoming better or worse relative to the goal expression.

 i use face as trend indicator here, if the profit is > .60 then smile is big.
case when  kpivalue("KPI") / kpigoal("KPI") >.60 then 1
when  kpivalue("KPI") / kpigoal("KPI") = .60 then 0
when kpivalue("KPI") / kpigoal("KPI") < .60 then -1
end


Note*  - In above code kpivalue("KPI") "KPI" is the name of KPI
   
4. Now process the KPI and Browse the same from button "Browse View"

What is KPI - key performance indicator

Key Performance Indicators, also known as KPI or Key Success Indicators (KSI), help an organization define and measure progress toward organizational goals.

Once an organization has analyzed its mission (goal, achievement) ,  it needs a way to measure progress toward those goals. Key Performance Indicators are those measurements.

KPI use to indicate the progress of organization (in form sales, school students strength, time related goal) the set goal is getting or loosing.

KPI may differ from different organization:
- A business may have one of key performance indicator as percentage of income that come from customers.
- A school can have target of number of students in per session.
- In IT company it can be of number of issues resolved in a day.

As a example
In IT company has set the goal for each employee, they have to resolve two issue atleast in a day.
It can leads to three cases:
1. Employee resolve more than 2 issue
2. Employee resolve less than 2 issue
3. Employee resolve equal to 2

for first case the report can indicate the green signal or up arrow
if employee resolve < 2 issue it will reflect down arrow or other user define image.


Whatever Key Performance Indicators are selected, they must reflect the organization's goals, they must be key to its success,and they must be quantifiable (measurable).

Good Key Performance Indicators vs. Bad
Bad:

    -Title of KPI: Increase Sales
    -Defined: Change in Sales volume from month to month
    -Measured: Total of Sales By Region for all region
    -Target: Increase each month

What's missing? Does this measure increases in sales volume by dollars or units? If by dollars, does it measure list price or sales price? Are returns considered and if so do the appear as an adjustment to the KPI for the month of the sale or are they counted in the month the return happens? How do we make sure each sales office's volume numbers are counted in one region, i.e. that none are skipped or double counted? How much, by percentage or dollars or units, do we want to increase sales volumes each month?

Good:
    -Title of KPI: Employee Turnover
    -Defined: The total of the number of employees who resign for whatever reason, plus the number of employees terminated for performance reasons, and that total divided by the number of employees at the beginning of the year. Employees lost due to Reductions in Force (RIF) will not be included in this calculation.
    -Measured: The HRIS contains records of each employee. The separation section lists reason and date of separation for each employee. Monthly, or when requested by the SVP, the HRIS group will query the database and provide Department Heads with Turnover -Reports. HRIS will post graphs of each report on the Intranet.
    -Target: Reduce Employee Turnover by 5% per year.


What Do I Do With Key Performance Indicators?
Once you have good Key Performance Indicators defined, ones that reflect your organization's goals, one that you can measure, what do you do with them?
- You use Key Performance Indicators as a performance management tool, but also as a carrot.
- KPIs give everyone in the organization a clear picture of what is important, of what they need to make happen.
- You use that to manage performance. You make sure that everything the people in your organization do is focused on meeting or exceeding those Key Performance Indicators. You also use the KPIs as a carrot.
- KPIs everywhere: in the lunch room, on the walls of every conference room, on the company intranet, even on the company web site for some of them.

EXAMPLE   
http://j4info.blogspot.in/2014/05/create-kpi-using-ssas-sqlserver.html

source http://management.about.com/cs/generalmanagement/a/keyperfindic_2.htm

Saturday, May 3, 2014

7. Hierarchy using NAMED QUERY in product table

Named Query in SSAS
A named query is a SQL expression represented as a table. In a named query, you can specify an SQL expression to select rows and columns returned from one or more tables in one or more data sources.
    -named queries can be used to split up a complex dimension table into smaller and simple dimension
    -named query can also be used to join multiple database tables from one or more data sources into a single data source view table.
   
    For example, suppose you want to create a hierarchy based on the product categories and subcategories. If make a look at post (6. Hierarchy using dimproduct, category and subcategory) , we can see that product categories and subcategories related data reside upto 3-level of dimension table.
   
1. create datasource.
2. create data source view using below tables. (see figure 1.2)
    fact - factinternetsales
    dim - dimproduct
 figure - 1

3. In Solution Explorer, expand the Data Source Views folder, then double-click the data source view.
4. In the Tables or Diagram pane, right-click an open area (of DimProduct) and then click replace table > with New Named Query. (see image -1.3)

   
5.    In the Create Named Query dialog box, do the following:
 figure -2
from image 2 do as follow:
    -In the Name text box, type a query name.
    -Optionally, in the Description text box, type a description for the query.
    -In the Data Source list box, select the data source against which the named query will execute.
    -Type the below query in the bottom pane, or use the graphical query building tools to create a query.
                SELECT
                  p.ProductKey,
                  p.EnglishProductName,
                  CASE
                    WHEN p.SpanishProductName = '' THEN  p.EnglishProductName
                    ELSE p.SpanishProductName
                  END AS SpanishProductName,
                  CASE
                    WHEN p.FrenchProductName = '' THEN p.EnglishProductName
                    ELSE p.FrenchProductName
                  END AS FrenchProductName,
                  p.ListPrice,
                  p.StandardCost,
                  s.EnglishProductSubcategoryName,
                  c.EnglishProductCategoryName
                FROM
                  DimProduct p
                  INNER JOIN DimProductSubcategory s
                     ON p.ProductSubcategoryKey = s.ProductSubcategoryKey
                  INNER JOIN DimProductCategory c
                     ON s.ProductCategoryKey = c.ProductCategoryKey
                WHERE
                  p.ListPrice IS NOT NULL;

5. Launch CUBE wizard
    - choose the factinternetsales table from wizard and finish the wizard as per below image.
 figure - 3

6. Now go to "solution explorer" double click on dimension "dimproduct.dim", now you can see the design page.
 figure - 4

    - drag and drop selected attribute from "data source view" pane to "attributes" pane. (see subimage 4.1)
    - open attribute relationship tab , delete all relation (see subimage -2)
    - to create hierarchy, drag and drop attribute from "attributes" pane to "hierarchy" pane (see subimage -4.3)
        order should be kept high to low.

7. Now move to attribute relationships tab. and drag and drop attribute as low to high order.
    - pick "English Product Subcategory Name" and drop onto "English Product Category Name"
    - pick "English Product Name" and drop onto "English Product Subcategory Name"
    - pick "product key " and drop onto "English Product Name"

   
8. Now process the dimension and drill down/up the dimension in "browser tab".
9. Now you can process the cube and play with it.
   

6. Hierarchy using dimproduct, category and subcategory

Let's create the cube using table dimproduct and its category. This is the also example of snow-flake schema.
1. create datasource view using below tables
    dimproduct,
    dimeproductcategory,
    dimproductsubcategory
figure-1 
As we can see category related data reside in tables upto 3-hierarchy level, so we can say that it can be a example of snowflake schema.
  
2. Now launch the Dimension Wizard from solution-explorer .
figure-2
 step to follow in dimension wizard from figure-2.
 - 2.2 chose main table dimproduct
 - 2.3 related table automatically get check and shown
 - 2.4 check the attribute if unchecked "Product Subcategory key" , "Product Category key","Color"
 - 2.5 Finish the wizard.

3. Now you can see dimension detail page where "Attributes","Hierarchy","Data Source View" pane are visible.
 figure -3
 Step to follow:
3.1 drag and drop the "English Product Name" attribute "Data Source View" pane  to "Attributes" pane.
3.2 Now we need to create hierarchy so that we can drill down the data.
   -  drag and drop attribute from "Attributes" pane to "Hierarchy" pane.
   - Order should be High to low hierarchy "Product Category key", "Product Subcategory key",
"English Product Name"
   - Move to "Attribute relationship" tab and recreate the relationship
   - pick "Product Subcategory key" attribute and drop onto "Product Category key"
   - pick "English Product Name" attribute and drop onto "Product Subcategory key"
   - pick "Product key" attribute and drop onto  "English Product Name".

3.3 change the "name column" properties of attribute
        1.Product Category Key > properties > namecolumn >to> EnglishProductCategoryName
        1.Product Subcategory Key > properties > namecolumn >to>


4. Now process the dimension and Move to "Browse" tab. where we can drill down /up the dimension only.
    Have a look on below image.
figure-4

5. Launch the cube wizard.
  figure -5

- Add fact "factInternetSales"
- Choose the columns, which are need to aggreagated. .
- Finish the cube wizard.

6. Process the project and browse the cube.

Friday, May 2, 2014

5. Cube using dimsalesterritory table

1. create the data source view using tables (after launching the "data source view" wizard)
    dimsalesterritory / dimcurrency / factresellersales

    figure-1
2. Here i create the dimension first and later on i create cube.
    you can also create the cube first and modify the dimension later in the same way we are creating the dimension.
   
3. Now Launch the dimension wizard to create dimension from "solution explorer".
    Below image have three subimages taken from dimension wizard.
   
figure-2
As per the subimage-2.3 i have check the attributes ( by default they are unchecked), so that further we can use them for hierarchy purpose.
    Finish the dimension wizard.
   
4. We can drill down the report with dimension country only if hierarchy is define with dimension country group/region.
    
    Now we need to create hierarchy, Drag and drop the ATTRIBUTES from "attribute pane" to "hierarchy pane"
    The order should be in high to low i.e. ST group/country/region.
   
figure-3  
 from tab "Attribute relationships"
    As per below image SSAS automatically create relation between dimension and key (see subimage -3.2)
    In order to recreate the relationship delete all the highlighted relationship (see subimage -3.2)
   
    how to create new relation
    1. by drag and drop
    2. order should be lowest to highest
    3. drag and drop the "sales territory country" onto "sales territory group"
    4. drag and drop the "sales territory region" onto "sales territory country"
    5. drag the drop "sales territory key" onto "sales territory region"
    now u can match the order with below image
 figure-4
   
5. Process and confirm the hierarchy in BROWSER tab.

6. Now launch the cube wizard from "solution explorer". Follow the step as below image

7. Process the project
8. Here we can play with data. we can slice,  we can drill down/up.


4. Create cube with user-define dimension hierarchy


Reapeat steps 1-6 from post
3. Create hierarchy on the basis of user-define dimension on self referencing table


8. create cube
    Goto > solution explorer > right lick on CUBE > "NEW CUBE"
    wizard  images as given below,


9. After finish the cube wizard, now we can process the project and can browse the data from browser tab.

3. Create hierarchy on the basis of user-define dimension on self referencing table

Before proceeding for the user-define dimension we have to drop the Foreign-Key constraint from table "DIMEMPLOYEE".

Use below command to drop the constraint.
USE [AdventureWorksDW]
GO

IF  EXISTS (SELECT * FROM sys.foreign_keys WHERE object_id = OBJECT_ID(N'[dbo].[FK_DimEmployee_DimEmployee]') AND parent_object_id = OBJECT_ID(N'[dbo].[DimEmployee]'))
ALTER TABLE [dbo].[DimEmployee] DROP CONSTRAINT [FK_DimEmployee_DimEmployee]
GO

1. Create datasource. Create new one or use pre-existing datasource connection
   
2. Create a Data source View with the help of wizard. To launch it right click on "Data source View" create new.
    Add below tables in data source view
    "DIMEMPLOYEE" , "DIMTIME" , "FactSalesQuota"
( figure-1)

3. In below image you can see there is no self reference arrow, so we have to tell it to that which column will act as "parentkey"

4. Now create a Dimension
    Right click "Dimensions" > "New Dimension" from "solution explorer"
    BE CAREFUL HERE
    While dimension create wizard on page "Select Dimension Attributes" ,
    here you can see "Parent Employee Key" attribute is unchecked here.
    NOW HERE
    - To make a hierarchical relationship you need to check "Parent Employee Key" attribute here or
    - you can add it after dimension creation wizard completion as you can see in subimage-2.2 below.
( figure-2)
   
5. Now you can see there is no automatic relation create between dimension because there is no FOREIGN KEY is present.

6. Now set "SET ATTRIBUTE USAGE" to "parent". Look at below image.

( figure-3)
7. Now process the dimension.
    after successful process now you can check the hierarchical data in browser tab.


2. Create cube having hierarchy dimension (self referencing table)

1. Create datasource connection to the server where DW database resides.
    Create new one or use pre-existing datasource connection
   
2. Create a Data source View with the help of wizard. To launch it right click on "Data source View" create new.

 (figure-1)

    table used -

  • dimemployee
  • dimtime
  • FactSalesQuota


3. to create cube -> Move to "Solution explorer"
    Right click on "Cubes" > create new.
  (figure-2)
  •     Run wizard
  •     on page "select measure group tables", choose "factSalesQuota" as highlighted in subimage -2.1
  •     You can look into subimage-2.2 the dimension automatically created on the basis of FK's.


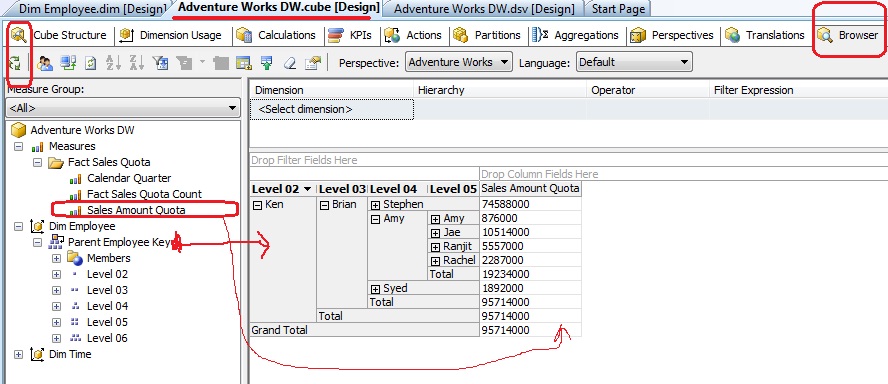
4. Change the properties of column "EmployeeID" set property "NameColumn" to "FirstName".
  (figure-3)

5. Now process the cube from the left most highlighted button
 (figure-4)

6. Now move to the Broser tab, here you can create cube report by drag and drop fact and dimension onto the graph area.
  (figure-5)
    Check the images it will be more clear to you.
   

1. Create hierarchy on the basis of regular dimension on self referencing table

1. Create datasource connection :

    Create new one or use pre-existing datasource connection and finish the wizard.
   
2. Create a Data source View with the help of wizard. To launch it right click on "Data source View" create new from "solution explorer".
Add table DimEmployee, because this table contains self reference data.


3. In below image you can see the self reference arrow, SSAS automatically check for FK's

4. Now create a Dimension Right click "Dimensions" > "New Dimension" from "solution explorer window.
 

(figure-4)

5. Now process the dimension.
    after successful process now you can see the browser tab in below image click on same tab.

( figure -5 )
6. Subimage-5.2 you can see the employee hierachy, expand all and check all hierarchy. Now we can see here it is showing "employeeID", but i want to see the employee name (employee related information) instead of "employeeID".

- To achieve this right click on "Employee Key" and click on properties.

- Now you can able to see the properties window in very bottom Right Hand side, scroll down there until you get the property NameColumn

- "NameColumn" , browse it to select "First name" or any from list as per your requirement.
(see subimage -5.3 )

Again process the Dimension and move to "Browser" tab and click on refresh button as shown in subimage-5.4

Wednesday, April 30, 2014

Cube hierarchy and its operations

Hierarchy
The elements of a dimension can be organized as a hierarchy, a set of parent-child relationships,
typically where a parent member summarizes its children. Parent elements can further be aggregated
as the children of another parent.


A Hierarchy is a set of logically related attributes with a fixed cardinality. While browsing the data, a hierarchy exposes the top level attribute which can be broken down into lower level attributes. For example, Year -> Semester – Quarter – Month is a hierarchy. While  analyzing the data, it might be required to drill down from a higher level to a detail level, and exposing data as a hierarchy.

example - dimemployee table have data in parent-child relation "employeeID" and "ParentEmployeeId".
SSAS example -  link soon provided


Operations to facilitate analysis.
Aligning the data content with a familiar visualization enhances analyst learning and productivity.
The user-initiated process of navigating by calling for page displays interactively, through the specification of slices via rotations and drill down/up is sometimes called "slice and dice".
Common operations include slice and dice, drill down, roll up, and pivot.

OLAP slicing
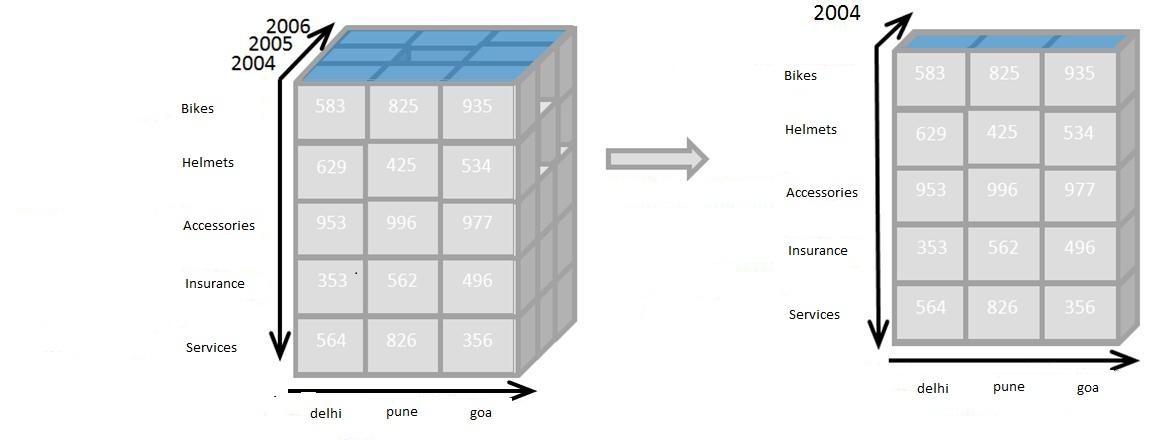
Slice is the act of picking a rectangular subset of a cube by choosing a single value for one of its dimensions, creating a new cube with one fewer dimension.

The picture shows a slicing operation: The sales figures of all sales regions and all product categories of the company in the year 2004 are "sliced" out of the data cube.
Query compare : equivalent to clause "where year = 2004"


OLAP dicing
Dice: The dice operation produces a subcube by allowing the analyst to pick specific values of multiple dimensions.

The picture shows a dicing operation: The new cube shows the sales figures of a limited number of product categories, the time and region dimensions cover the same range as before.
Query compare - equivalent to "where year in (2004,2005,2006) and category in ('bikes','helmets','acc.')"


OLAP Drill-up and drill-down
Drill Down/Up allows the user to navigate among levels of data ranging from the most summarized (up) to the most detailed (down).
Drill down presenting the data at lower level on hierarchy.
Drillup presenting the data at higher level on hierarchy.

The picture shows a drill-down operation: The analyst moves from the summary category "bike" to see the sales figures for the individual products.
Drill down and up can be possible if we have meaningful hierarchical data in schema.

Roll-up: A roll-up involves summarizing the data along a dimension. The summarization rule might be computing totals along a hierarchy or applying a set of formulas such as "profit = sales - expenses".


OLAP pivoting
Pivot allows an analyst to rotate the cube in space to see its various faces. For example, cities could be arranged vertically and products horizontally while viewing data for a particular quarter. Pivoting could replace products with time periods to see data across time for a single product.

The picture shows a pivoting operation: The whole cube is rotated, giving another perspective on the data.


Source: http://en.wikipedia.org/wiki/OLAP_cube

Some topic related posts
OLAP CUBE
Storage types of cube MOLAP, ROLAP, HOLAP
Advantage and disavantage of MOLAP, ROLAP
Create your first OLAP Cube in SSAS 

Friday, April 25, 2014

SSAS CUBES HIERARCHY examples

Getting Start with SSAS sqlserver analysis services
examples of start schema
1. Create hierarchy on the basis of regular dimension on self referencing table
    Complete with DIMEMPLOYEE table
   
2. Create cube with above dimension hierarchy
    using table "DIMEMPLOYEE" , "DIMTIME" , "FactSalesQuota"

3. Create hierarchy on the basis of user-define dimension on self referencing table
    Complete with "DIMEMPLOYEE" table    
   
4. Create cube with user-define dimension hierarchy   
    using table "DIMEMPLOYEE" , "DIMTIME" , "FactSalesQuota"
   
5. Hierarchy using dimsalesterritory table
    using table dimsalesterritory / dimcurrency / factresellersales

example of snowflake schema   
6. Hierarchy using dimproduct, category and subcategory
    using table dimproduct, dimeproductcategory, dimproductsubcategory
   
7. Hierarchy using NAMED QUERY in product table.

Note:-
In HIERARCHIES pane of dimension:
    The of of hierarchy column should in high to low level like below example
    Lets a product manufacturer company, manufacturer the product and
    1. level 1 - have two type of products (a) bikes and (b) accessories
    2. level 2 - Bike can be of different types (mountain bike , dirt bike, regular bike) and
    3. level 3 is bike names

    so correct order will be products > product type > product name (product > category > subcategory )
   
In ATTRIBUTE RELATIONSHIP tab the hierarchy should be set lower to higher (just do reverse of above).

Wednesday, March 12, 2014

Create your first OLAP Cube in SSAS


I get below links to create olap cube in SSAS using database AdventuresWorksDW. These links provide very clear cut guidance (step by step) to create a cube in ssas.


Let's create an Analysis Services Cube using the new Cube Wizard that comes with SQL Server 2008 Business Intelligence Development Studio.

Please follow the steps below (make a click on each step for details):

  1. Create an Analysis Services Project
  2. Create a Data Source
  3. Create a Data Source View
  4. Create a Cube
  5. Create perspectives
  6. Deploy the Analysis Services Project

OLAP CUBE

What is OLAP cube:- 
An OLAP cube is a collection of measures (facts) and dimensions from the data warehouse.
An OLAP cube is a multidimensional database that is optimized for data warehouse and online analytical processing (OLAP) applications.
An OLAP cube is a method of storing data in a multidimensional form, generally for reporting purposes.
In OLAP cubes, data (measures) are categorized by dimensions.

Data and aggregations are stored in a (pre-summarized across dimensions) optimized format to offer very fast query performance.
MDX (multidimensional expressions) query language is used to interact and perform tasks with OLAP cubes.
The MDX language was originally developed by Microsoft in the late 1990s, and has been adopted by many other vendors of multidimensional databases.

Although it stores data like a traditional database does, an OLAP cube is structured very differently.
OLAP cubes, however, are used by business users for advanced analytics.
Thus, OLAP cubes are designed using business logic and understanding.
They are optimized for analytical purposes, so that they can report on millions of records at a time.

When to use CUBE-
There are three reasons for adding a cube to your solution:
1. Performance-  A cube’s structure and pre-aggregation allows it to provide very fast responses to queries that would have required reading, grouping and summarizing millions of rows of relational star-schema data.
The drilling and slicing and dicing that an analyst would want to perform to explore the data would be immediate using a cube but it could take longer when using a relational data source.

2. Drill down functionality-  Many reporting software tools will automatically allow drilling up and down on dimensions with the data source is an OLAP cube.
    Some tools, like IBM Cognos’ Dimensionally Modeled Relational model will allow you to use their  product on a relational source and drill down as if it were OLAP but you would not have the performance gains you would enjoy from a cube.

3. Availability of software tools-  Some client software reporting tools will only use an OLAP data source for reporting. These tools are designed for multi-dimensional analysis and use MDX behind the scenes to query the data.

Disadvantage of using SSAS cube-
SSAS processes data from the underlying relational database into the cube.
After this is done the cube is no longer connected to the relational database so changes to this database will not be reflected in the cube.
Only when the cube is processed again, the data in the cube will be refreshed.

So Basically what the cube is:-
A cube is a structure made of number of dimensions, measures, etc.
Cubes usually rely on two kind of tables like 'fact-table' (for cubes) & 'dimension-table' (for cube’s different dimensions).
A cube can have only one fact-table and ‘n’ number of dimension tables (based on no: of dimensions in the cube).
It store the data in pre-aggreagted form.


see also storage type`s of cube MOLAP, ROLAP, HOLAP
web stats